
!["Numbers [arrow] Narrative" written on a whiteboard](/_next/image?url=https%3A%2F%2Fcdn.sanity.io%2Fimages%2F5ijtcvpv%2Fdevelopment%2F48ac4ed9ea55731361dee6eb127b129dfff5d6c7-1024x683.png&w=3840&q=75)
Every day, the world adds close to half a zettabyte – nearly 500 million terabytes – of data to our collective knowledge. Much of this data, however, is unstructured - raw, unorganized, and absent of context.
Data without context is just numbers. To derive understanding and action, data needs to be woven into narratives that resonate with people on a human level. This fusion of statistics and storytelling - data storytelling - has become an increasingly common cornerstone of effective business communication.
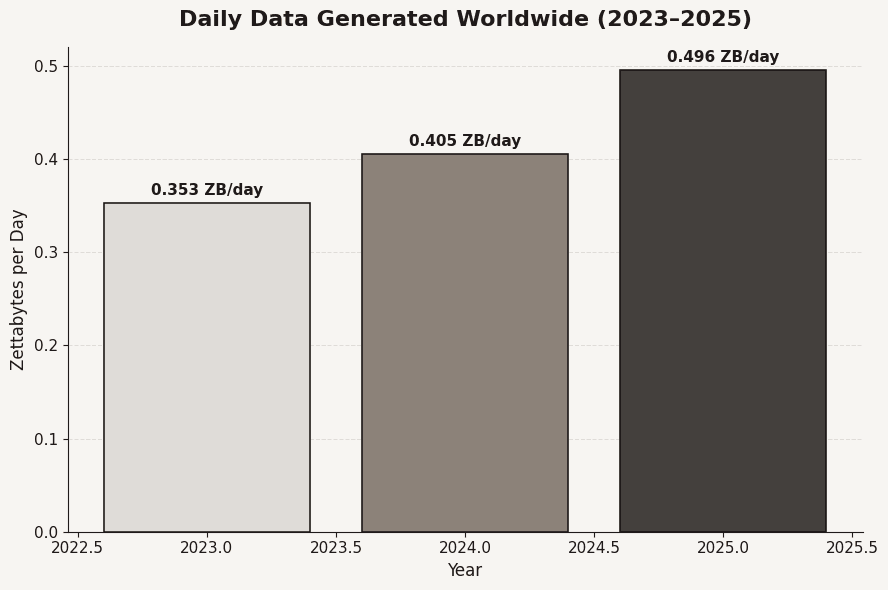
Global Data Growth
Why Storytelling Works
Cognitive psychologist Jerome Bruner noted that humans have two primary modes of thinking: (1) paradigmatic thinking, which is used for logical reasoning and truth finding, and (2) narrative thinking, which is concerned with intentions and actions. Narrative thinking is essential for making sense of human experience and understanding the world we live in.
Stories are memorable. Unsurprisingly, stories are much more memorable than facts alone. In 1969, Stanford researchers found that students improved their recall of words by up to 700% when the words were embedded in a story,1 and researchers in 1980 found that people recall stories they’ve read twice as well as encyclopedia entries.2
Stories resonate. Data typically appeals to logic, while stories appeal to emotion. When data and story are used together, people can be moved both intellectually and emotionally. Moreover, storytelling offers us the opportunity to humanize data, making insights not only digestible, but also relatable.
Stories travel. Think of the earliest stories you heard growing up. Chances are, you heard the story from someone else – a parent, grandparent, or a childhood friend, perhaps? People have been telling stories for thousands of years. As people traveled, so too did their stories. We are natural storytellers, and data storytelling taps into our natural instinct to share our stories with others.
The Shaping of (Data) Stories
So what exactly is data storytelling? Harvard Business School defines data storytelling as “the ability to effectively communicate insights from a dataset using narratives and visualizations” [cite]. It’s a blend of analytical skill and creative communication. Rather than simply reporting numbers or creating a slide full of charts, a data storyteller crafts a narrative where the data plays a supporting role in a broader story. Now, this doesn’t mean diluting or “spinning” the facts – it simply means contextualizing them. Narrative provides the “why” and “who” behind the numbers: who is affected? What are the stakes? Why do these metrics matter? How do these numbers connect to a bigger picture?
Data Storytelling in Action: How Global Brands Turn Data into Business Impact
Spotify Wrapped – Turning Personal Data into Viral Engagement
Spotify’s annual Wrapped campaign is a masterclass in data storytelling and customer engagement. Each year, the company curates a personalized “year-in-review” for every user, transforming their listening data (e.g., top songs, artists, genres, minutes listened, etc.) into a vibrant narrative. The experience feels like a personal story—complete with shareable visuals formatted like social media “stories”—that taps into listeners’ nostalgia and identity. By framing user statistics as “your soundtrack” or “your anthem”, Spotify makes data deeply personal and emotionally resonant.
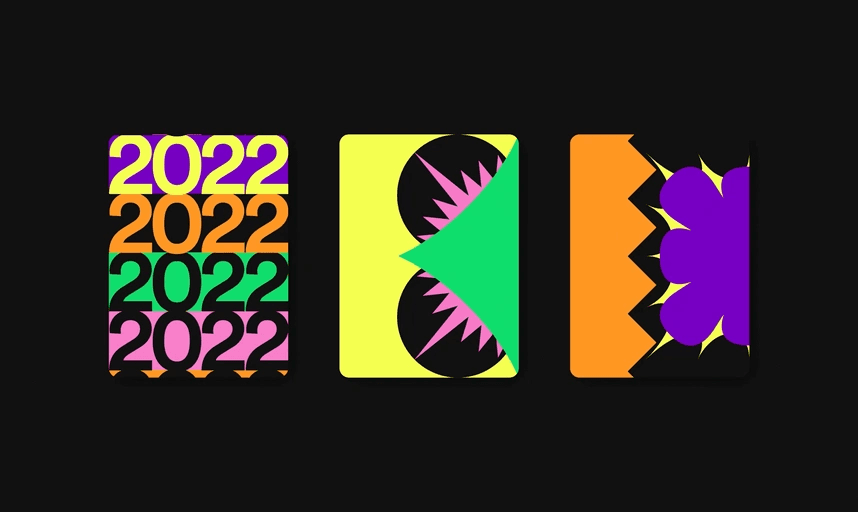
Design of Spotify Wrapped in 2022, © Spotify
Spotify Wrapped’s Storytelling Approach
Spotify presents each user’s data as a literal story, with interactive slides, playful graphics, and in 2024, AI-generated audio commentary.3 Instead of boring users with a simple list of their listening stats, Spotify Wrapped distills data-driven insights into an fun and engaging UX – celebrating each user’s top tracks and quirky listening habits in a way that’s easy to understand and encourages users to more deeply explore and engage with. Moreover, the thoughtful design of Spotify Wrapped encourages social sharing, tapping into fear-of-missing-out (FOMO), social currency, and parasocial relationships (did your favorite celebrity share their “soundtrack of the year”?)
Spotify’s results have been mesmerizingly successful. In 2021, over 120 million Spotify users accessed Wrapped, with nearly 60 million stories and graphics shared on social media. A year later, in 2022, participation exploded to 156 million users4!4 Beyond virality, the campaign strengthens loyalty – users look forward to it as an annual tradition – in addition to boosting revenue streams like advertising (since first launching Wrapped in 2016, Spotify’s ad revenue has surged by over $200 million).
Starbucks ‘Deep Brew’ - Pouring in Customer Loyalty
Starbucks has deeply integrated data storytelling into its digital customer experience. Through the Starbucks mobile app and rewards program, the coffee giant uses its Deep Brew AI to turn customer data into personalized recommendations, offers, and experiences. Every time a customer purchases, pays, or even skips their usual latte, that data goes into a narrative about their preferences – which Starbucks uses to create personalized drink suggestions, timely promotions, and rewards that seem hand-selected. Essentially, Starbucks is telling each customer the story of their personal coffee journey (e.g., commemorating their 50th latte purchase with a reward, or suggesting a new roast that's comparable to their usual picks).
Starbucks Deep Brew AI
Starbucks’ Storytelling Approach
The Starbucks app is the hub of its digital customer experience – it analyzes purchase history, visit patterns, and even the weather to present customers with relevant content – from a warm drink suggestion on a cold morning to bonus stars for trying a food item they haven’t had before. These data-driven “stories” appear as dynamic messages: “Because you love mocha, you might enjoy our new Molten Chocolate Latte” – narrating to the customer that Starbucks knows them. The brand also leverages gamification (e.g. progress toward free rewards) to make the data narrative interactive. Internally, Starbucks uses data dashboards (the “Digital Flywheel”) to continuously learn and refine what delights its customers.
Starbucks’ data storytelling has resulted in big “wins” in customer engagement. As of Q1 2024, the Starbucks Rewards program reached 34.3 million active U.S. members, up 13% year-over-year,5 indicating that more customers are joining and staying due to the personalized experience.
Apple Watch: Stories of Progress
Apple has long excelled at blending technology with human narrative, and the Apple Watch Is a perfect example for the company’s data-storytelling prowess. While its sensors capture reams of raw health and activity data, Apple deliberately frames those numbers as stories of progress, achievement, and well-being. This design choice has elevated the Watch from being just another wearable device to a daily companion that motivates millions to move, reflect, and stay healthy.

Watch | sourced via Unsplash
Apple’s Storytelling Approach
From its inception, Apple positioned the Watch as more than a timepiece: it’s a personal health narrator. The Activity Rings are perhaps the most iconic example. Instead of showing calories burned or minutes exercised in sterile charts, the Watch depicts a colorful set of rings that gradually close as you progress through your goals. Each day becomes a narrative arc—from the first stand reminder in the morning to the satisfying closure of the rings at night.
Apple extends this narrative with gamification and milestones: congratulatory animations, achievement badges, and monthly challenges. These elements transform numbers into moments of celebration. The Watch also personalizes context, surfacing weekly summaries like “You averaged 10,000 steps a day this week—keep it going!” This reinforces a story of consistency and growth rather than just presenting abstract statistics.
At a broader level, Apple amplifies storytelling in its marketing and keynotes by sharing user testimonials. Stories of people whose Watch detected an irregular heartbeat, guided them through a stressful moment, or even alerted them to life-threatening conditions turn aggregated health data into powerful narratives of human resilience and safety. These stories give the device cultural weight and emotional resonance.
Data -> Analysis -> Narrative -> Action
The Data Storytelling Process
The Data → Analysis → Narrative → Action cycle captures the journey from raw information to meaningful impact. It begins with data, the unprocessed facts and figures that describe reality but lack context. Through analysis, patterns emerge, insights are uncovered, and the noise is distilled into signals. Yet analysis alone rarely inspires; it must be framed into a narrative—a coherent story that connects the numbers to human experience, stakes, and emotions. This narrative then guides action, transforming insight into decisions, behaviors, or strategies that drive change. By cycling through these stages, organizations ensure that data isn’t just collected, but translated into stories that move people and ultimately deliver results.
Footnotes
- https://www.researchgate.net/publication/232549160_Narrative_stories_as_mediators_for_serial_learning#:~:text=a%20large%20number-,of,Ss ↩
- Graesser, A. C., N. L. Hoffman and L. F. Clark (1980). “Structural components of reading time.” Journal of Verbal Learning and Verbal Behavior 19(2): 135–151. ↩
- https://blog.google/technology/google-labs/notebooklm-spotify-wrapped/ ↩
- https://time.com/6340656/spotify-wrapped-guide-2023/#:~:text=The%20popularity%20of%20Spotify%20Wrapped,end%20phenomenon ↩
- https://www.customerexperiencedive.com/news/starbucks-rewards-loyalty-q3-personalization/706212/#:~:text=,to%20turning%20occasional%20customers%20into ↩